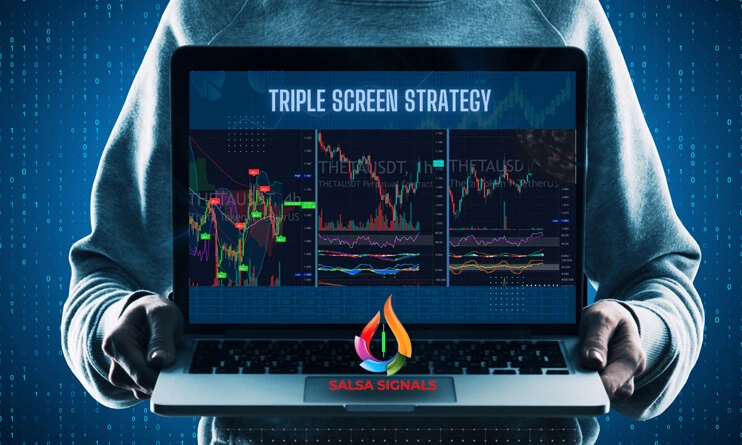
The Triple Screen Trading System (Credit to: Dr. Alexander Elder – The New Trading for a Living)*
Developed by Dr. Alexander Elder, The Triple Screen Trading System applies three tests (or screens) to every trade. Many trades that seem attractive at first are rejected by one or another screen. The trades that pass the Triple Screen test are much more likely to succeed.
The Triple Screen combines trend-following indicators on long-term charts with counter-trend oscillators on the intermediate charts. It uses special entry techniques for buying or selling short as well as tight money management rules. The Triple Screen is more than a trading system: it is a method, a style of trading.
Choosing Timeframes;
As you might have noticed, the trend for a specific asset can be both up and down at the same time, depending on what charts you use. A daily chart may show an uptrend, while a weekly chart shows a downtrend, and vice versa. We need a system to handle conflicting signals in different timeframes.
Begin by asking yourself, what is your favourite timeframe? Whatever timeframe you choose as your favourite, the Triple Screen calls that one the Intermediate timeframe, then the Long-term timeframe is one higher, and the Short-term timeframe is one lower. Once you select your Intermediate timeframe, you may not look at it until you examine the longer-term timeframe and make your strategic decision there.
For example, at SALSA Signals, we carry a trade for 2-48 hours and usually map it on the 1h timeframe chart, hence the 1H chart will be our favourite timeframe and referred to as the Intermediate Timeframe. Our Long-term Timeframe will be the 4h, and our Short-term Timeframe the 15min.
Triple Screen demands that you examine the long-term chart first as it allows you to trade only in the direction of the tide – the trend on the long-term chart. It uses the wave that goes against the tide for entering positions. For example, when the 4h trend is up, the 1h declines, create buying opportunities. When the 4h trend is down, the 1h rallies provide shorting opportunities.
First Screen (Long-term TF) – Market Tide
At SALSA, the 4H timeframe is our preferred long-term chart (4x higher than our favourite/intermediate chart).
Before you even glance at your favourite/intermediate timeframe, go to your long-term chart as that’s where you’ll make your strategic decision to be a bull or a bear. After that, you can return to your intermediate timeframe and start making tactical decisions, such as where to enter and where to place a stop.
If you make the mistake of looking at the 1h (intermediate) timeframe first, you’ll be prejudiced by its patterns. First make an unbiased decision on the long-term 4h chart before even glancing at the 1h.
The best indicators to use on the long-term chart to establish the trend are the EMAs (Exponential Moving Averages, eg. 21, 55 and 200).
A trader has 3 choices: buy, sell, or stand aside. The first screen of the Triple Screen System will take away one of those options.
Second Screen (Intermediate-Term TF) – Market Wave
The second screen of Triple Screen identifies the wave that goes against the tide. When the 4h trend is up, then the 1h declines point to buying opportunities. When the 4h trend is down, then the 1h rallies point to shorting opportunities.
The second screen applies oscillators to the 1h chart in order to identify deviations from the 4h trend. Oscillators give buy signals when markets decline and sell signals when they rise. The second screen of the Triple Screen allows you to take only those signals on the 1h charts that put you in gear with the 4h chart.
Indicators to apply as oscillators are RSI or Stochastic RSI and MACD Cross-overs.
Third Screen (Short-Term TF) – Entry Technique
The third screen is your Entry Technique, and here we at SALSA use the 15min timeframe for our entry points. (4x shorter than the intermediate timeframe).
On this time frame you can apply indicators which point to price reversals, like candle patterns, support and resistance bounces, break off the Bollinger Band by the Lagging span etc. to find that sniper entry.
Stops and Profit Targets
Proper money management is essential for successful trading. A disciplined trader takes his profits at targets, cuts losses short, and outperforms those who keep hoping and hanging on to bad trades. Before you enter a trade, write down three numbers: the entry, the target, and the stop as placing a trade without defining these three numbers is gambling.
Triple Screen calls for setting profit targets using long-term charts and stops on the charts of your intermediate timeframe. If you use 4h and 1h charts, like SALSA Signals, set profit targets on the 4h but stops on the 1h. When buying a dip on a 1h, the value zone (support or resistance) on the 4h presents a good target.
The Triple Screen system calls for placing fairly tight stops. Since it has you trading in the direction of the market trend, it doesn’t give much room to losing trades. Get on with the trend – or get out.
Now that you know a bit more about how we call our signals, why not try them out for yourself?…
Salsa Signals is no longer available in our online store. Visit the BitcoinTAF Online Store here to find other similar products.
The Salsa Signals Team
*Credit and book source can be found here


