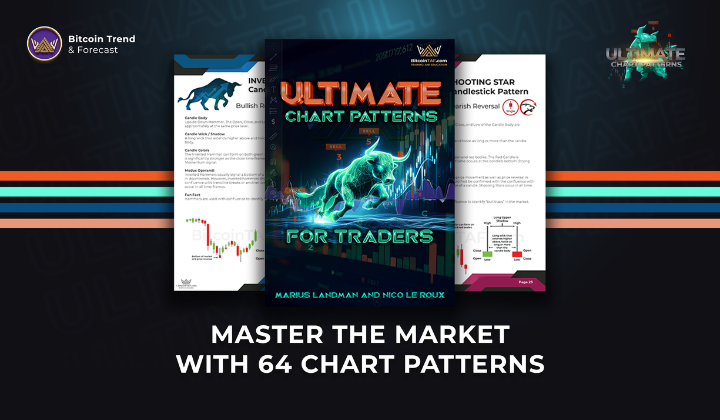
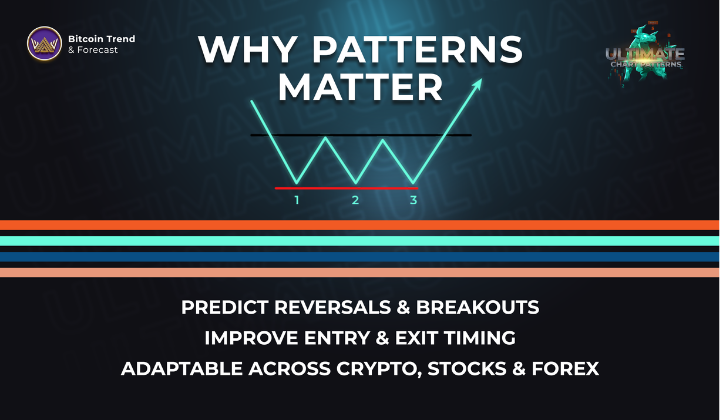
Why Recognizing Patterns Gives You a Trading Edge
Chart and candlestick formations are the visual cues of market psychology. From Johannesburg to New York, skilled pattern recognition helps traders spot reversals, breakout opportunities, and support/resistance zones before these moves become widely visible. The Ultimate Patterns for Traders PDF, now updated with 22 new patterns since May 2025, is the most comprehensive pattern reference for crypto and stock traders.
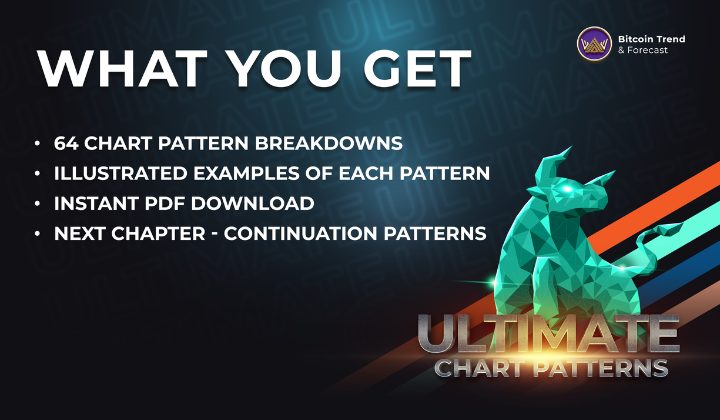
What You’ll Find Inside the PDF
64 Total Patterns Covering Reversals & Continuations
– 30 Candlestick Patterns (Bullish & Bearish Reversal) – Think Bull Tweezer, Bearish Engulfing Candle, Hammer, Morning Star, and more.
– 34 Chart Patterns (Bullish & Bearish Reversal) – Including Head & Shoulders, Bull Flag, Ascending Flag, Cup & Handle, Wedges indicating market reversals, and continuation setups like triangles and rectangles.
– Elliott Wave Corrective Waves Book – Dive deeper into market cycles and wave analysis.
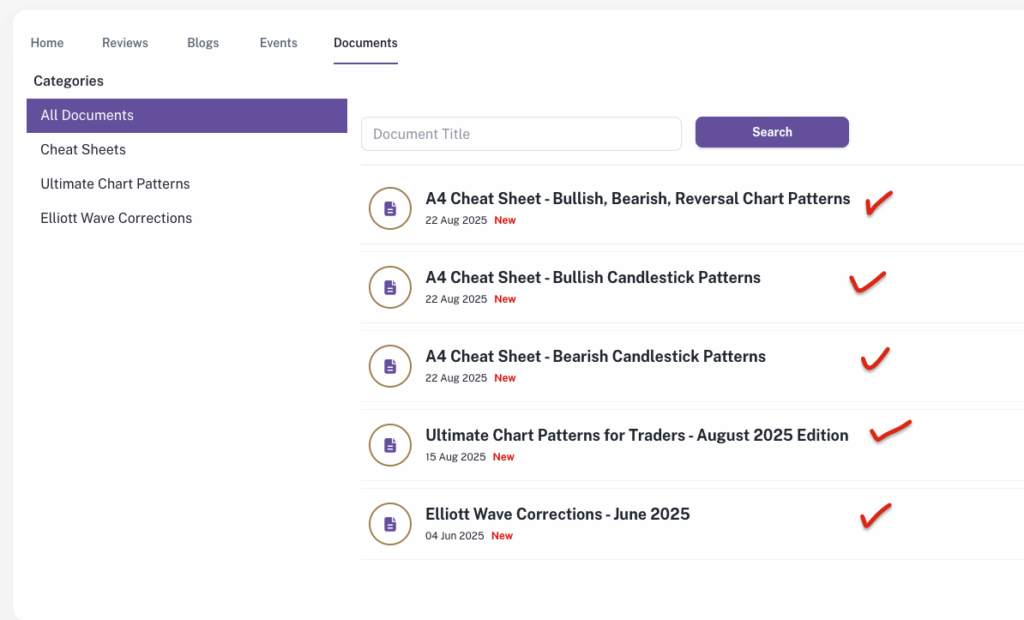
– A4 Cheat Sheets (Bullish & Bearish Pattern Guide) – A handy visual reference for quick use during live trading sessions.

Bonus Reference Tools for Traders
Recent Crypto Breakouts — Patterns That Trended in 2025
Bitcoin’s Bull Flag Breakout (July 2025)
A classic bull flag propelled Bitcoin toward higher highs. CoinDesk’s technical analysis highlighted this pattern, projecting a 30% rally, targeting ~$140,000. The setup offered a clear continuation signal as the prior consolidation phase ended.
Cup & Handle Pushes Bitcoin Higher (July 2025)
Bitcoin’s breakout above ~$118,000 formed a cup-and-handle. Targets near $134,500 were confirmed by positive MACD momentum.
Ethereum Surging Toward All-Time Highs
In August 2025, Ethereum broke beyond its 2021 high, nearing $4,945, lifted by institutional ETF flows and growing investor interest.
Altcoin Momentum and ETH-BTC Rebalancing
Tech signals show Ethereum and altcoins gaining traction while Bitcoin dominance falls below 60%, similar to past bullish cycles. The ETH/BTC ratio and ETF inflows indicate a shift of capital toward DeFi and alt sectors.
ETH Breakouts in Sideways Markets (April 2025)
Ethereum’s 15% surge followed a period of low trading volume—a pattern often preceded by decisive moves. Volume compression, Bollinger Bands tightening, and RSI divergence signaled likely breakout—textbook chart behavior.
Why These Real Examples Matter for Traders
Bull Flag (BTC): Helps you enter strong trend moves after pause phases.
Cup & Handle (BTC): A foundational bullish continuation setup with reliable upside.
All-Time High Breakouts (ETH): Confirms bullish dominance and momentum continuation.
Volume & RSI Structures (ETH): Enhances timing accuracy around breakouts in quiet markets.
Altcoin Rotation Signals: Indicates when to shift focus beyond Bitcoin, aligning with market cycles.
All of these structures are visually explained in the Ultimate Patterns for Traders PDF — turning live charts into actionable setups!
Who Should Use This Guide
- Crypto Traders on platforms like Binance, KuCoin, MEXC and many others.
- Stock Traders via NASDAQ, NYSE, EasyEquities.
- All Styles of Traders: Swing, Day, Scalping and long-term.
Download & Trade with Confidence
The Ultimate Patterns for Traders PDF is available as an instant download, no subscription required—just a lifetime of pattern knowledge.
Pair it up with other BitcoinTAF products!
This PDF is ideal to be used in conjunction with your trading style and Indicators and can be used with any of the BitcoinTAF products and services like the following: