Introduction to the Wyckoff Patterns
If you’ve ever watched Bitcoin grind sideways for months, dump just enough to liquidate longs, then rocket to a new all-time high – you’ve watched a Wyckoff Pattern play out in real time. Wyckoff Patterns are the closest thing crypto has to a smart-money playbook, and they explain price action better than almost any indicator on your screen. This guide skips the long history lesson and gets straight to what matters: how Wyckoff Accumulation and Wyckoff Distribution actually work in crypto, where they’ve shown up on real Bitcoin charts, and why they belong in every trader’s toolkit.
A Quick Word on Richard D. Wyckoff
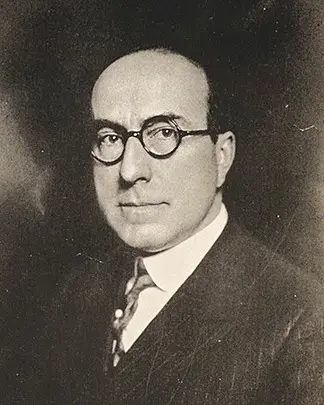
Richard D. Wyckoff (1873–1934) was an American stock trader who started on Wall Street at 15 and went on to found The Magazine of Wall Street. He spent decades watching legendary operators like Jesse Livermore and J.P. Morgan move markets, then codified what he learned into a teaching course in 1931 — the foundation of what traders today call the Wyckoff Method. His goal was to give regular traders the same edge as the big players. Almost a century later, that goal is more relevant than ever, especially in crypto
The Core Wyckoff Concepts (In Plain English)
Supply and Demand
When buyers outweigh sellers, price rises. When sellers outweigh buyers, price falls. Wyckoff’s whole framework is about reading price and volume together to see which side is winning.
The Composite Man
Imagine all market activity as the work of one giant operator — the Composite Man — who quietly buys low, drives price up, sells high, and crashes price down to start the cycle again. In crypto, this isn’t even a metaphor. Whales, market makers, and exchange desks really do behave this way.
The Four Phases: Accumulation, Markup, Distribution, Markdown
Accumulation: Smart money quietly buys after a crash.
Markup: Price trends up as demand takes over.
Distribution: Smart money sells to euphoric latecomers near the top.
Markdown: Price collapses, completing the cycle.
Cause and Effect
The bigger the sideways “cause” (the trading range), the bigger the “effect” (the trend that follows). A six-month Bitcoin base usually leads to a much bigger rally than a two-week one.
Effort vs. Result
When huge volume produces only a tiny price move, something is wrong — usually a sign the trend is exhausted. This is one of the earliest warning signs of a top or bottom.
How Wyckoff Accumulation Actually Works
The BitcoinTAF Chart Patterns booklet breaks Wyckoff Accumulation into five clean phases that map perfectly onto crypto bear-market bottoms:
Phase A: Stopping the Decline: Selling exhausts itself. You’ll see a Selling Climax (SC), an Automatic Rally (AR), and a Secondary Test (ST) that retests the lows on lower volume.
Phase B: Building the Cause: Price chops sideways for weeks or months. Large operators absorb supply while volume slowly contracts.
Phase C: The Test (The Spring): This is the magic moment. Price briefly dumps below support, liquidating leveraged longs and trapping shorts — then snaps back. A successful Spring with low volume and a fast recovery is one of the highest-probability signals in all of trading.
Phase D: The Transition: A Sign of Strength (SOS) breaks resistance, followed by a Last Point of Support (LPS) pullback that offers the cleanest entry in the entire pattern.
Phase E: The Markup: Price leaves the range and a new uptrend begins.


Wyckoff Reaccumulation: The Pattern Inside a Bull Run
Reaccumulation uses the same five-phase structure, but it forms during an uptrend rather than after a crash. Large holders pause, absorb profit-taking from weak hands, then push price higher. In crypto bull markets, reaccumulation ranges are everywhere – every multi-week consolidation between Bitcoin’s leg-ups is a candidate.
The booklet’s trading insight on reaccumulation is gold for crypto traders: “Best entries often come on the pullback to the broken resistance (now support) after the breakout. Watch for decreasing volume on dips inside the range and increasing volume on rallies.” Stops go below the range support – simple, mechanical, effective.
Why Wyckoff Fits Crypto Better Than Stocks
Wyckoff developed his framework for stocks, but it arguably fits crypto even better. Here’s why:
Crypto is whale-driven. A handful of large holders genuinely control most of Bitcoin’s float. The Composite Man isn’t theoretical — he’s on-chain.
Leverage amplifies every phase. Crypto’s massive perp-futures market means Springs and Upthrusts are violent, obvious, and often liquidate billions in a single candle.
Cycles are clean. Bitcoin’s roughly four-year halving cycle produces textbook accumulation, markup, distribution, and markdown phases that are easier to spot than anything in equities.
Volume is transparent. Every trade prints on exchanges or on-chain, making effort-vs-result analysis straightforward.
Retail behaviour is extreme. Crypto’s emotional extremes – panic selling at bottoms, FOMO buying at tops – are exactly what Wyckoff designed his framework to exploit.
The flip side: crypto markets never sleep, news moves prices instantly, and a single regulatory announcement can invalidate even the cleanest pattern. Wyckoff is a guide, not a guarantee.
Top Reasons Crypto Traders Should Pay Attention to Wyckoff
It explains Bitcoin’s halving cycle. The four phases line up almost perfectly with Bitcoin’s four-year rhythm.
It catches bottoms before indicators do. Springs print before the RSI turns up or the moving averages cross.
It gives mechanical entries. The Last Point of Support is a defined, repeatable trade – not a vibe.
It works across timeframes. From 15-minute scalps to weekly macro calls, the same phases apply.
It exposes manipulation. Once you see a Spring, you’ll never get shaken out of a bottom by a fake liquidation wick again.
It pairs perfectly with other patterns. Wyckoff Accumulation often contains a falling wedge, a double bottom, or a rounding bottom inside it – confluence you can stack.
It builds discipline. Wyckoff forces you to wait for confirmation. In a market designed to make you click, that alone is an edge.
Wyckoff Doesn't Live Alone! Stack It With Other Patterns
Wyckoff is most powerful when combined with the broader pattern toolkit. The BitcoinTAF Chart Patterns booklet covers every major category crypto traders need:
Candlestick Patterns: Hammers, Engulfings, Morning Stars, Three White Soldiers, and dozens more for spotting reversals and momentum shifts inside Wyckoff phases.
Reversal Patterns: Double and triple bottoms, head-and-shoulders, falling wedges, and rounded bottoms that frequently form inside Phase C of an accumulation.
Continuation Patterns: Bull flags, pennants, cup-and-handles, and high-tight flags that appear during the markup phase.
Bilateral Patterns: Ascending, descending, and symmetrical triangles that often resolve out of reaccumulation ranges.
Consolidation Patterns: Rounding bottoms and rectangle bases that overlap directly with Wyckoff structures.
Wyckoff Accumulation and Reaccumulation: The newest section in the booklet, with clean schematics and crypto-specific trading insights.
A Bitcoin chart rarely shows just one pattern. A bullish hammer at the Spring, a falling wedge inside Phase B, a bull flag in early markup — that’s the kind of confluence that turns a guess into a high-probability setup.

FAQs - Wyckoff Patterns
Q: Is the Wyckoff Method still relevant in 2026? Yes! Arguably more than ever. Crypto’s whale-driven structure makes Wyckoff fit better than it ever did in modern equities.
Q: What’s the difference between Wyckoff Accumulation and a regular sideways range? Real accumulation has identifiable phases (A through E) and specific volume signatures. A random range doesn’t.
Q: Can beginners learn Wyckoff? Yes. The concepts are intuitive – the difficulty is pattern recognition, which comes with screen time.
Q: Does Wyckoff always work? No method works 100% of the time. Wyckoff is a probability framework. Risk management still matters.
Q: What’s the difference between accumulation and reaccumulation? Accumulation forms after a downtrend and starts a new bull run. Reaccumulation forms during an existing uptrend as a pause before the next leg up.
Wyckoff Patterns aren’t a relic – they’re a practical, battle-tested framework for reading crypto markets the way the biggest players actually trade them. Accumulation, markup, distribution, markdown, the Composite Man, cause and effect, effort vs. result: six simple ideas that explain almost every major Bitcoin move of the last decade. Learn them, combine them with the rest of your chart pattern toolkit, and you’ll start seeing setups other traders completely miss.
Get the Updated 90+ Chart Patterns Booklet - Now With Wyckoff!
The BitcoinTAF Ultimate Chart Patterns booklet has just been updated with a brand-new Wyckoff Patterns section, including full Wyckoff Accumulation and Reaccumulation schematics, phase-by-phase breakdowns, and crypto-specific trading insights you can put to work on your very next Bitcoin setup.
Inside, you’ll get the complete pattern library every crypto trader needs — candlestick patterns, bullish and bearish reversals, continuation patterns, bilateral triangles, consolidation structures, and now Wyckoff – all in one professionally designed reference built specifically for cryptocurrency markets.


